Week 1: HTML / SVG ('Drawing')
Introduction
In this first week, we will get familiar with HTML, and its extension SVG. HTML is responsible for drawing and creating the structure of every webpage online – including the page you're reading right now. To learn in a practical manner, we will put the things we learn directly into practice. We will do this by replicating a series of visualizations from Du Bois' exhibit on African-American life at the turn of the nineteenth century. You can read more about this curious series in the recent book Visualizing Black America or check out this six (!) part series at Towards Data Science. You can find all visualizations from the exhibit over at the Library of Congress.
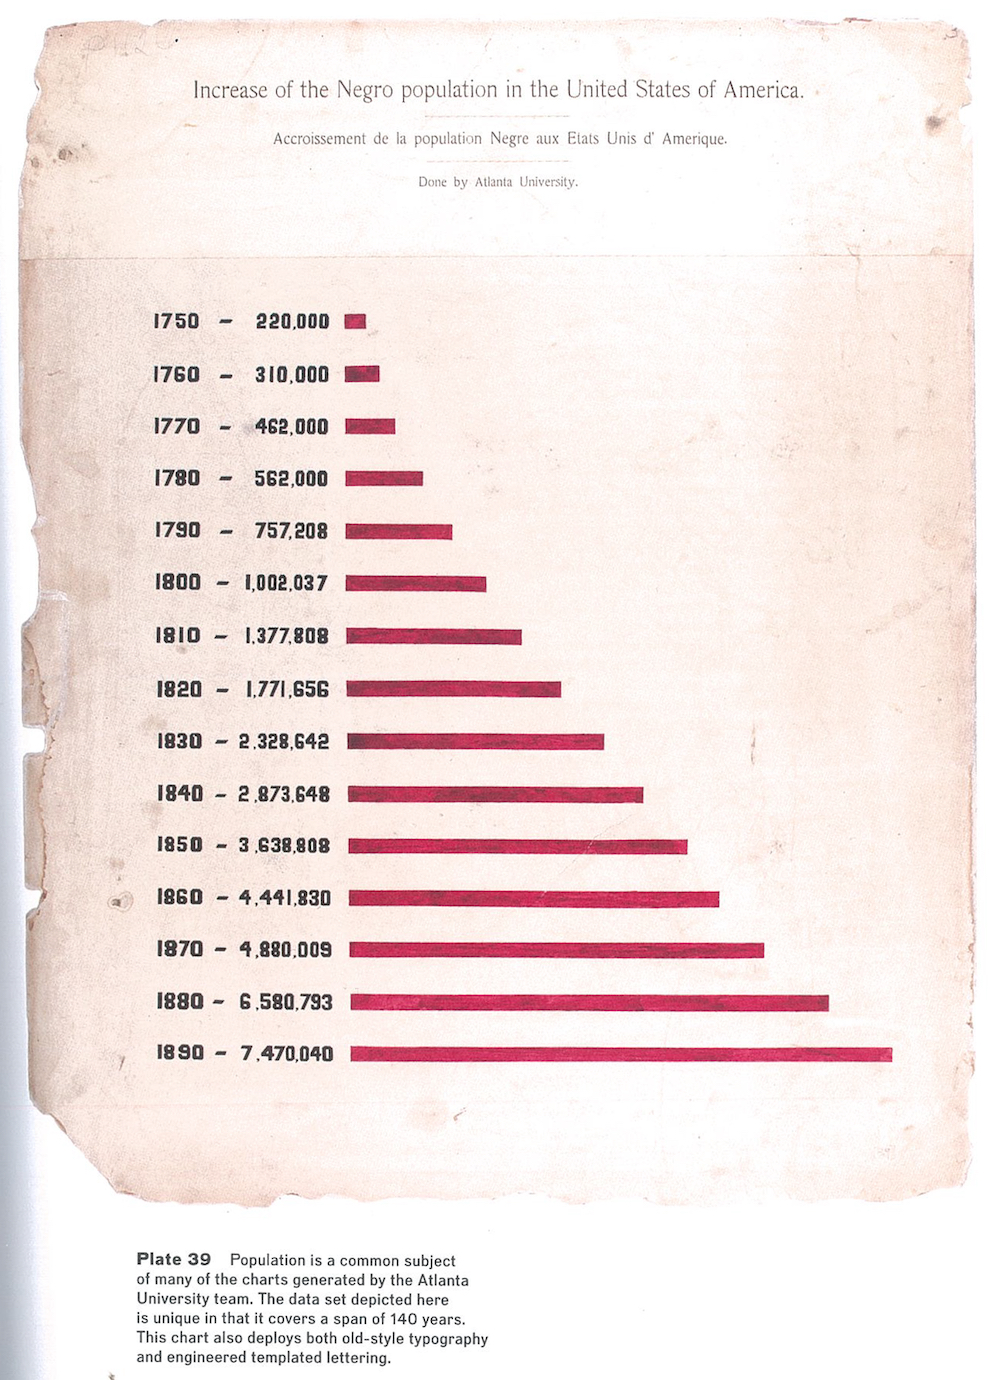
To keep things simple, I have selected a relatively straightforward bar chart for these first weeks. Our goal will be to replicate the below chart. In the first week, we will draw its structure with HTML (and its extension SVG) and in the second week we will 'paint' or style this structure with CSS.
HTML
HTML is short for HyperText Markup Language (HTML). It a language that consists of elements that describe the structure of a document. You're already familiar with this concept – a book has a title; it has chapters; and each chapter generally consists of sections and paragraph, perhaps with the addition of other things such as footnotes and figures. Each of these logical parts of a book, or a document in general, corresponds to an element in HTML.
Before starting on the next section, I highly recommend you work through the first section (Overview + Getting Started) of Introduction to HTML. Don't worry if you don't understand everything yet – that's completely fine as we'll review the most important aspects together in this exercise. We'll be here when you get back!
In most practical circumstances, we do not create HTML completely from scratch (phew!). Instead we will use a boilerplate template to get us started a bit more quickly. I have provided one for you below. The whole HTML document is quite short. Every HTML document always starts with an <html> opening tag – and closes on the very last line with an </html> closing tag. You can always recognize closing tags by the forward slash /. Keep a mental note that every element we create in HTML always needs to be opened AND closed.
The <head> of our document contains some document metadata (like the title that you see at the top of your browser window) but it doesn't affect the way the page is drawn so we'll ignore it for now. <body> is where the magic happens. Anything included here will actually be rendered and drawn on the page by your browser. For 99.9% of your time developing web applications, you'll be working within the <body>.
Right now, the <body> only contains a single element to get us started. The <h1> tag creates a header element of the highest (1) level.
<html>
  <head>
    <meta charset="UTF-8" />
    <title>Plate 39</title>
  </head>

  <body>
      <h1>
        Increase of the Negro population
        in the United States of America.
      </h1>
  </body>
</html>
We can look at an interactive version of our HTML document in the CodeSandBox below. Obviously, we are currently still quite a few steps removed from reproducing our graph. Let's get started by inserting a few of the non-graphical elements. We already have one h1 header, but there's a few other (sub)headers, as well as a caption below the chart. Let's create these by using the following tags:
h2- creates a header element of the second level. You can read more about each element over at MDN.h3- creates a header element of the third level. MDN.p- creates a paragraph element, usually a block of text. MDN.div- creates a container element. It has no specific meaning or impact on how things are rendered but can, for example, be used to group similar things together. MDN.
We will do this section in class together (you can do it right there in the CodeSandbox!) – we will fill in this space with our solution and a run-through of how each element is (to be) used afterwards.
Solution
In this case, we use the <div> element to organize our content into a header section and a footer section.
Do you notice the <!-- bit? That's an HTML comment - you can use them to add comments in the code that will not be rendered or interpreted as HTML.
<div>
  <!-- title/header content goes here -->
  <h1>Increase of the Negro population in the United States of America.</h1>
  <h2>Accroissement de la population Negre aux Etats Unis d' Amerique.</h2>
  <h3>Done by Atlanta University.</h3>
</div>
<div>
  <!-- footer content goes here -->
  <p>
    Plate 39. Population is a common subject of many of the charts generated
    by the Atlanta University team. The data set depicted here is unique in
    that it covers a span of 140 years. This chart also deploys both
    old-style typography and engineered templated lettering.
  </p>
</div>
SVG
To start drawing the graphical parts of the chart, we will have to make an excursion from HTML to Scalable Vector Graphics (SVG) – think of it as an extension to HTML. SVG is almost like HTML – it also based on elements that are indicated via tags – but it is specifically designed to create graphics. It's very versatile and not constrained to just browsers. If you're familiar with drawing or vector programs like Adobe Illustrator, they also can create, read and export SVG files. What HTML is to a document, SVG is to a graphic: a consistent way to describe its structure.
Before you continue, please read the Introduction and Getting Started sections of the MDN SVG Tutorial.
The foundational layer of a graphic constructed with SVG is a an empty 'canvas' that will become the container for anything we'd like to draw within it. You do this by adding an svg element (MDN reference) with a certain width and height to the page. You already know how to create elements in HTML and, luckily, SVG elements are specified in the exact same way. To add the width and height to this element, you need to add them as attributes to the element. Both SVG and HTML elements can have such attributes and you can always look up which elements are available at the handy MDN reference pages (that's why we link to them consistently!). You specify attributes like this:
<element nameOfYourAttribute="valueOfYourAttribute">
  content of your element
</element>
You can add more than one attribute by separating them with a space. In our case, we want to create an SVG element to hold our chart of 600 by 600 pixels. Add the below svg element to your CodeSandBox in the right location (between the header and the footer). Once it is placed, you should see the page update and show an empty placeholder where we will now build our graph.
<svg width="600" height="600">
    <!-- svg content goes here -->
</svg>
Let's start by drawing the first 'entry' in the bar chart. To do so we only need to make use of two types of SVG elements:
Note that you will have to read the MDN reference page to find out which attributes you need to use for each element to position it correctly within the graphic. This is good practice because there are so many new elements to learn about that translating from a reference page to your particular application is an important skill.
We will do this section in class together (you can do it right there in the CodeSandbox!) – we will fill in this empty space with our solution and a run-through of how each element is (to be) used afterwards.
Solution
We will have to make good use of the attributes available for both the text and the rect element. Most importantly, we need to position elements so they get drawn at the right location within the blank canvas that we have created. To do this, it is very important to remember that the coordinate system for SVGs (and HTML in general) has an origin (coordinate 0,0) in the top-left corner. In our case, this means that the (600,600) coordinate will be in the bottom-right corner of the SVG.
We can either eye-ball the positions in the original graph (and some trial and error) or use a pixel measuring tool (e.g. Apple's Preview) to take more exact measurements on the positions and dimensions in the original graph: ![]()
Once we have measured the left and top margins as well as the dimensions of the rectangle we can use these to set the correct attributes.
<svg width="600" height="600">
  <text x="22.5" y="15">1750</text>
  <text x="70" y="15">–</text>
  <text x="100" y="15">220,000</text>
  <rect x="165" y="15" height="11" width="17" />
</svg>
Note that the text and the rectangle do not seem to appear at the same level: 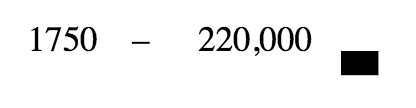
That is because rectangles (and other graphical elements) have their position 'baseline' at the top of the element, while the default baseline for text elements is at the bottom of the element. One of the quirks of web development! There are a few ways to address this discrepancy. For now, we will use the dominant baseline attribute on the text element. This only works well in Chrome but it is the simplest solution. In later weeks, we will cover more solid solutions for this. We also use the opportunity to right-align the third text element by changing the anchor point to the 'end' of the element (defaults to beginning).
<svg width="600" height="600">
  <text x="22.5" y="15" dominant-baseline="hanging">1750</text>
  <text x="70" y="15" dominant-baseline="hanging">–</text>
  <text x="153" y="15" dominant-baseline="hanging" text-anchor="end">
    220,000
  </text>
  <rect x="165" y="15" height="11" width="17" />
</svg>
Bringing this all together in a single sandbox:
Once you have created the first entry/bar, it is a matter of rinse & repeat to draw all the other bars. Let's add them all! To organize each entry in a logical unit, we can use the g or group element. It just like div but then specially made for graphics. Like so (the attributes of text and rect are left out):
<g>
    <!-- a bar -->
    <text>First Text Element</text>
    <text>Second Text Element</text>
    <text>Third Text Element</text>
    <rect />
</g>
We will do this section in class together (you can do it right there in the CodeSandbox!) – we will fill in this empty space with our solution and a run-through of how each element is (to be) used afterwards.
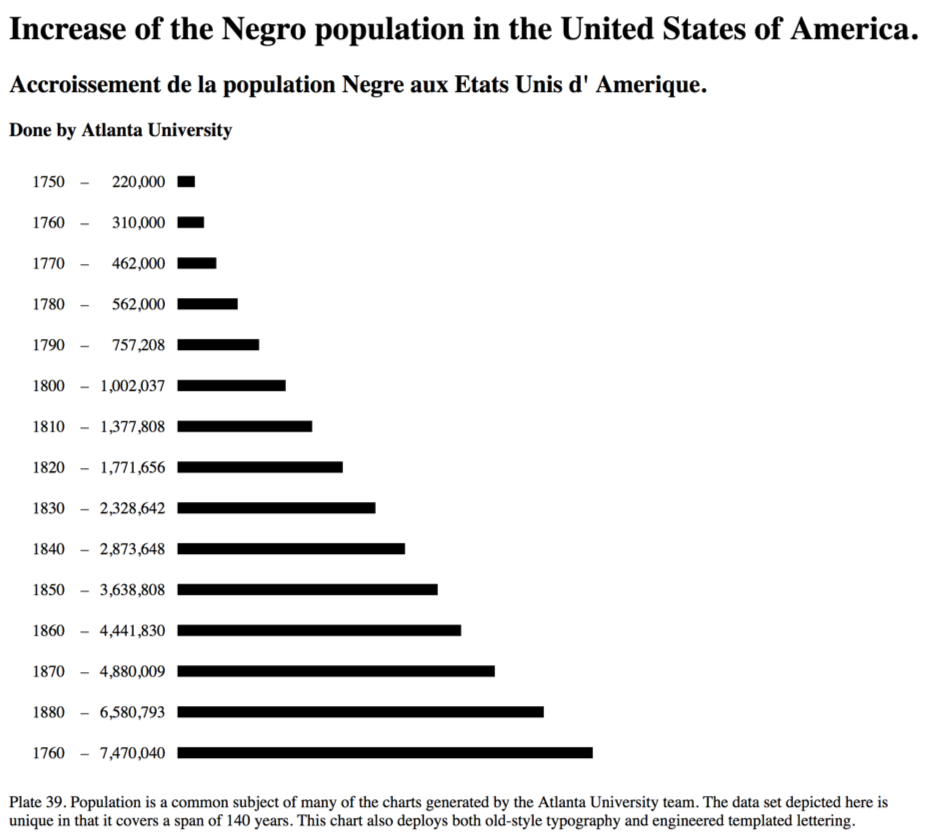
Ultimately, our graph will look some thing like this.
Solution
Your final code should look similar to the below sandbox.
As we expect, this is not a complete reproduction of the Du Bois graph yet but it has all the structural elements in place. In other words, everything that needs to be drawn, is drawn – just not with exactly the right styling. Styling is a task for CSS, which we will cover in the next week.
If you have time left and want to work ahead, as part of this first block's assignment, you will not only reproduce this particular graph but also choose another graph to reproduce completely by yourself. Browse through the available choices at the Library of Congress – you can choose your own challenge-level (e.g. those curved bar charts require some extra thinking..), but for now stay away from the map-based figures. We will pick up the thread on styling/CSS next week but you already now enough to reproduce the structure of your graph with HTML.
Recap
By the end of this week, you should be able to understand and apply in practice the following concepts:
- Inserting HTML elements through opening and closing tags.
- When & how to use
<h1>-<h6>,<p>and<div>HTML elements. - Inserting SVG elements through opening and closing tags (including self-closing elements)
- When & how to use
<svg>,<text>,<rect>and<g>SVG elements. - When & how to assign attributes to SVG elements.
- Use MDN to search SVG/HTML documentation and adopt new elements and their attributes.