Week 2: CSS ('Styling')
Introduction
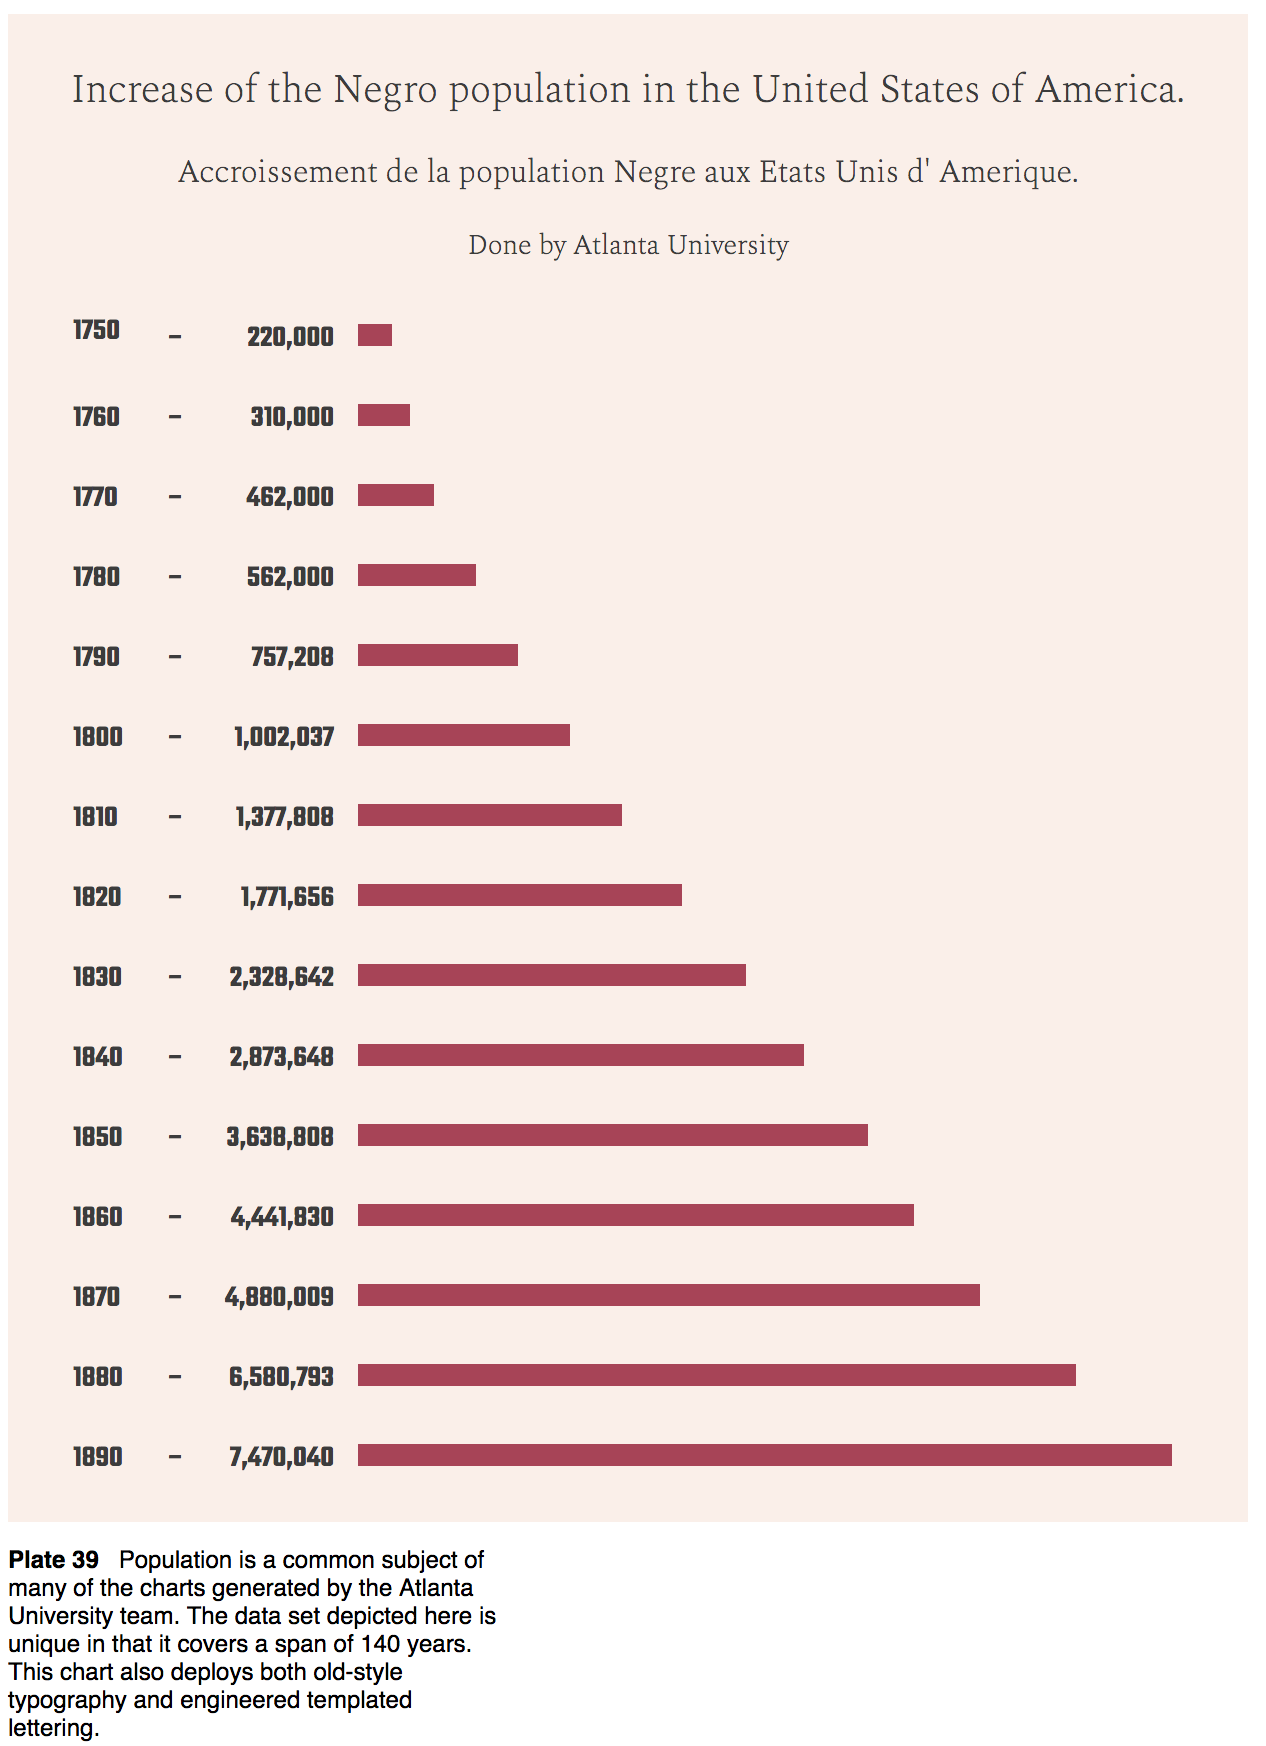
In the previous week we took a first, and big, step to recreate our chart from Du Bois' Paris exhibit. We created all necessary elements and positioned them, more or less, in their right location. This week's challenge is to style each of these elements to more closely reflect the original. As HTML and SVG are used to build up the structure of web pages, we style that structure with Cascading Style Sheets, or CSS for short. We will build forth on MDN's introduction to CSS and will apply what we learn there in the context of our data visualization.
Fonts
We apply CSS styling rules to any HTML/SVG element on our page by selecting it. There are different types of 'selectors' that allow you to select elements based on different logic, depending on your specific needs. We will start by selecting elements based on the type (e.g. elements can be of type 'p' or type 'h1' etc.). In our digital reproduction, the font used for the title elements (<h1>-<h3>) looks quite a bit different from the actual graph made by Du Bois. Our first task is to rectify that. We will do so by first selecting the appropriate heading and then adding a style 'rule' or declaration to that selector.
For now, we include such styling rules in our main webpage by adding a <style> element to the <head> of the page. The <style> element will instruct the browser that anything within it consists of CSS and should be used to style the page.
<head>
    <meta charset="UTF-8" />
    <title>Plate 39</title>
    <style>/*  */
    /* css styles go here */</style>
</head>
To style our h1 header we simply include its name/type followed by curly braces {}. All statements, or declarations, within the curly braces will be applied to the element matching the selector. A declaration always ends in a semi-colon ;. You can add multiple declarations to apply to the same selector by simply separating them with a new line (enter) within the curly braces.
h1 {
    color: yellow; /* this will turn your header yellow! */
}
When we measure the exact color of the original text, it turns out to be about rgb(60, 60, 60) (don't worry too much about color for now, we'll cover it in more detail later). Use MDN's color docs to find out the best way to apply this color to all h1, h2 and h3 elements.
You will also notice that the default headers are much bolder than we want. In CSS this is called the font weight. In a text editor like Microsoft Word, we often only have the distinction between normal and 'bold', but in CSS we set the weight of a font much more precisely by using numerical values. 400 is the normal font weight, while 700 is generally what is referred to as bold. Let's set our font weight to 200 for all header elements as well.
Finally, the default font used for the headers isn't very exciting nor is it close to the original font that Du Bois used. There are lots of ways to use different fonts with CSS. For now, we'll use Web Fonts. You can use local fonts (if you have the correct license – not all fonts are free to use) or one of the many online font services (for some you pay, others are providing free fonts).
For now, we will use Google Fonts to add additional, custom fonts to our visualizations. I have pre-selected two fonts for us to use that are reasonably close (at least in spirit) to the lettering that Du Bois and his collaborators used. Spectral, a serif font for our headers, and Teko, a display font we will use for our graph labels. To include them in our web page, we need to include a link to 'fetch' the font and its associated styling rules from Google's servers. Once we have then that, we can use and apply the font to any element by referring to its name in the font-family property.
<head>
    <meta charset="UTF-8" />
    <title>Plate 39</title>
    <link
      href="https://fonts.googleapis.com/css?family=Spectral:200"
      rel="stylesheet"
    />
    <link
      href="https://fonts.googleapis.com/css?family=Teko:600"
      rel="stylesheet"
    />
    <style>h1,
      h2,
      h3 {
        font-family: "Spectral", serif;
        font-weight: 200;
        color: rgb(60, 60, 60);
      }</style>
  </head>
You can now apply the right fonts to all the header and graph elements. Do make sure you set the right font-size for each as well.
We will do this section in class together.
Solution
Note how we can specify multiple font families for all text-like elements. We do this to have a 'fallback' option if somehow the fetching of our preferred font from Google goes awry. For the headers we fall back on the system's default serif font and for the graph text, we fall back on the system's default sans serif font.
Color in SVG
Now that we have taken care of the styling of the header and text elements, we can focus on the remaining elements of the actual chart. One of the main outstanding differences with the original graph is the use of color. Because SVG is focused on graphical elements specifically (compared to HTML's more general document elements), we also have two specific ways of coloring elements. Namely, we make a distinction between coloring the outline or stroke of the element and coloring the inside or fill of the element (as opposed to having a single color property in HTML). Let's set the right color for the graph labels (rgb(60, 60, 60)) and the bars (rgb(167, 68, 87)).
We will do this section in class together.
Solution
As we don't need to use a different color for the outline or stroke of the elements, we simply use the fill property for both the text as well as the rect elements.
/* graph elements */
text {
    font-family: "Teko", sans-serif;
    font-weight: 600;
    font-size: 15px;
    fill: rgb(60, 60, 60);
}

rect {
    fill: rgb(167, 68, 87)
}
Class-based Selectors
We still have a few remaining items to style. So far we have only used type-based selectors. This is already quite useful but what do we do if we want to style elements of the same type differently? We can now longer use the same approach. Instead, we can use selectors based on class. A class is special type of attribute that we can assign to any element we'd like. You can come up with your own classes, and multiple elements can have the same class. We do so by using the attribute name class on any element and add the class name as the attribute value.
<div class="title"></div>We can refer to this particular class from within our CSS specification by prefacing the name of the class with a period (.). The period instructs the browser to look for a class name instead of an element type.
.title {
    /* declarations go here */
}
We can use this technique to give different sections of our graph a different class and use each class to style those sections accordingly. For example, if we hold our entire visualization (svg and all the headers) in a div with class viz, we can limit its width to certain dimensions:
.viz {
    width: 600px;
}
Try to use what you now know about classes, css selectors and divs to accomplish the following:
- Constrain the width of the visualization (including its headers) to 600px
- Apply a background color to the graph of
rgb(250, 239, 233)(roughly the color of the paper) - Center all headers within the graph
- Constrain the footer/caption to 250px width, applying appropriate font styling to the text.
Bonus points:
- Notice that the title of the caption is bolder than the rest of the caption and there's a certain amount of white space to the right of the title. Try to accomplish this. Hint: use the
<span>element.
Your final results should look something like this – not that far off from the original!
Solution
Note that we have moved our CSS from including it inside of a <style> element in our main HTML document to a separate file. As styling rules can grow quite large, this is often a useful practice to keep the size and structure of your documents somewhat manageable. You can do this by copy-pasting the styling rules to a new file (we called it style.css, but you can call it whatever you like) and instruct the browser to fetch and use it by including <link href="style.css" rel="stylesheet" /> in the head of the HTML document, just like we did with our custom fonts.
To establish the white space to the right of the caption title, we add a <span> element around the caption title. The span element is a container element, just like the <div> but then for in-line use (e.g. inside of a paragraph). It has no direct effect on how the content is rendered but we can use it add a class to the element and use that class for subsequent styling with css (we do so here through the plateTitle class).
To create white space around elements in HTML, there are two important CSS properties to take note of: padding and margin. They are the key elements of the CSS box model. Padding extends the area of the content of an element (so padding is sort-of part of the content), while margin extends an empty area outside of the content (so margin is not part of the content).
In this case, we apply a margin to the right of the plate title of 10px. But we also apply a padding of 15 pixels to the entire visualization so that the headings are placed at an appropriate distance from the edge of the 'paper'. Our element with the viz class is equal to the paper here. Margin would be placed outside of the 'paper' and would thus not get the same background color as the paper color assigned to the viz element. By using padding instead, the edge of the paper (including its background color) is extended. Try it out by increasing the padding or replacing it with margin instead!
Recap
By the end of this week, you should be able to understand and apply in practice the following concepts:
- When & how to assign classes to HTML elements.
- Applying CSS styling to HTML elements, either through the inclusion of a
<style>element or a separate.cssfile that you fetch through something like<link href="style.css" rel="stylesheet" />. - When & how to 'select' HTML elements, using both type and class selectors, in CSS.
- When & how to use CSS declarations.
- The potential difference between CSS properties for HTML and SVG elements (e.g.
colorversusfillandstroke). - When & how to use web fonts.
- Use MDN to search the CSS documentation and adopt new CSS properties and their values to achieve a certain style.